Our commitment to you
Support
- Our Manual, in full or lite version, ready to be consulted with all the technical information.
- Supporting material and documentation to help you understand and get the most out of CLOVER MSDAS.
- Video Tutorials with all the workflows in an easy way to understand and see all the CLOVER MSDAS features.
- FAQ’s section with all tips, definitions and resolved doubts that we have all needed in some point.
- Keep in touch with our support team. They are here to help and guide you.
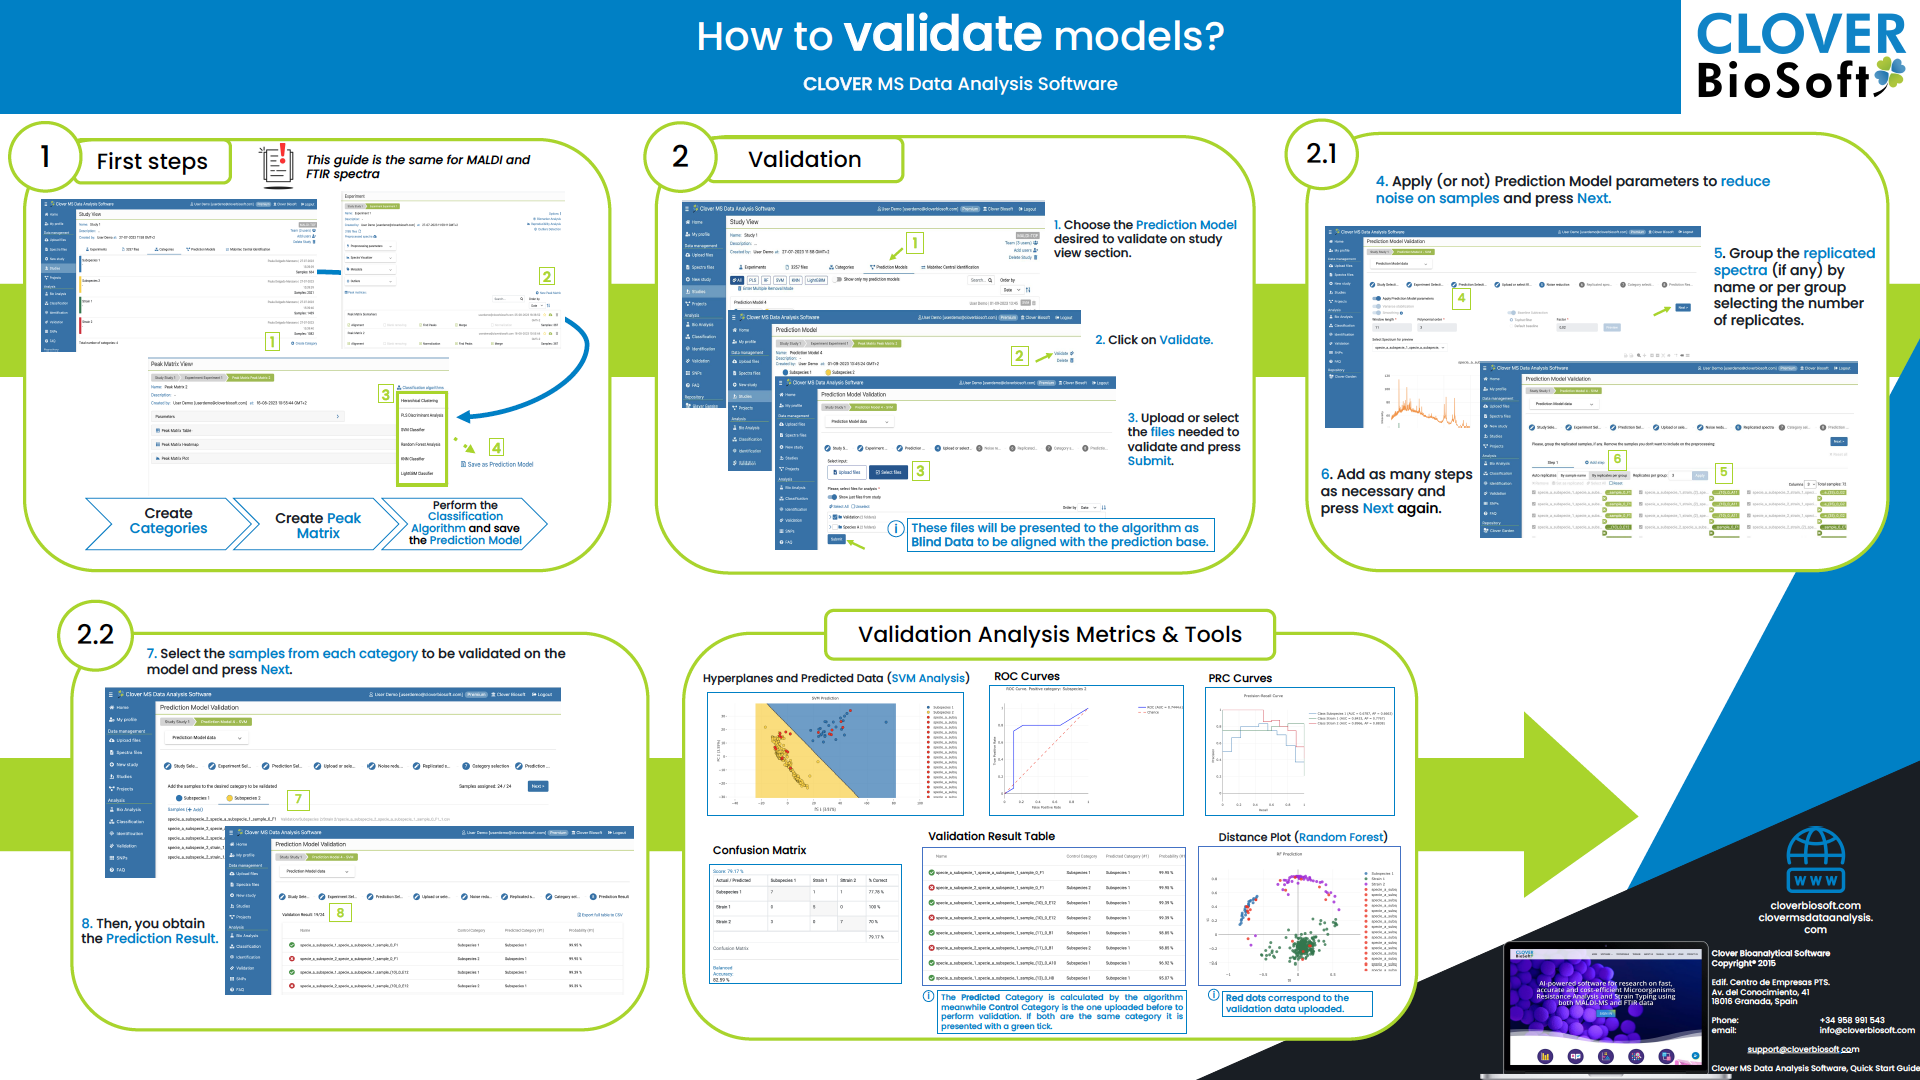
Supporting material and Quick Start Guides
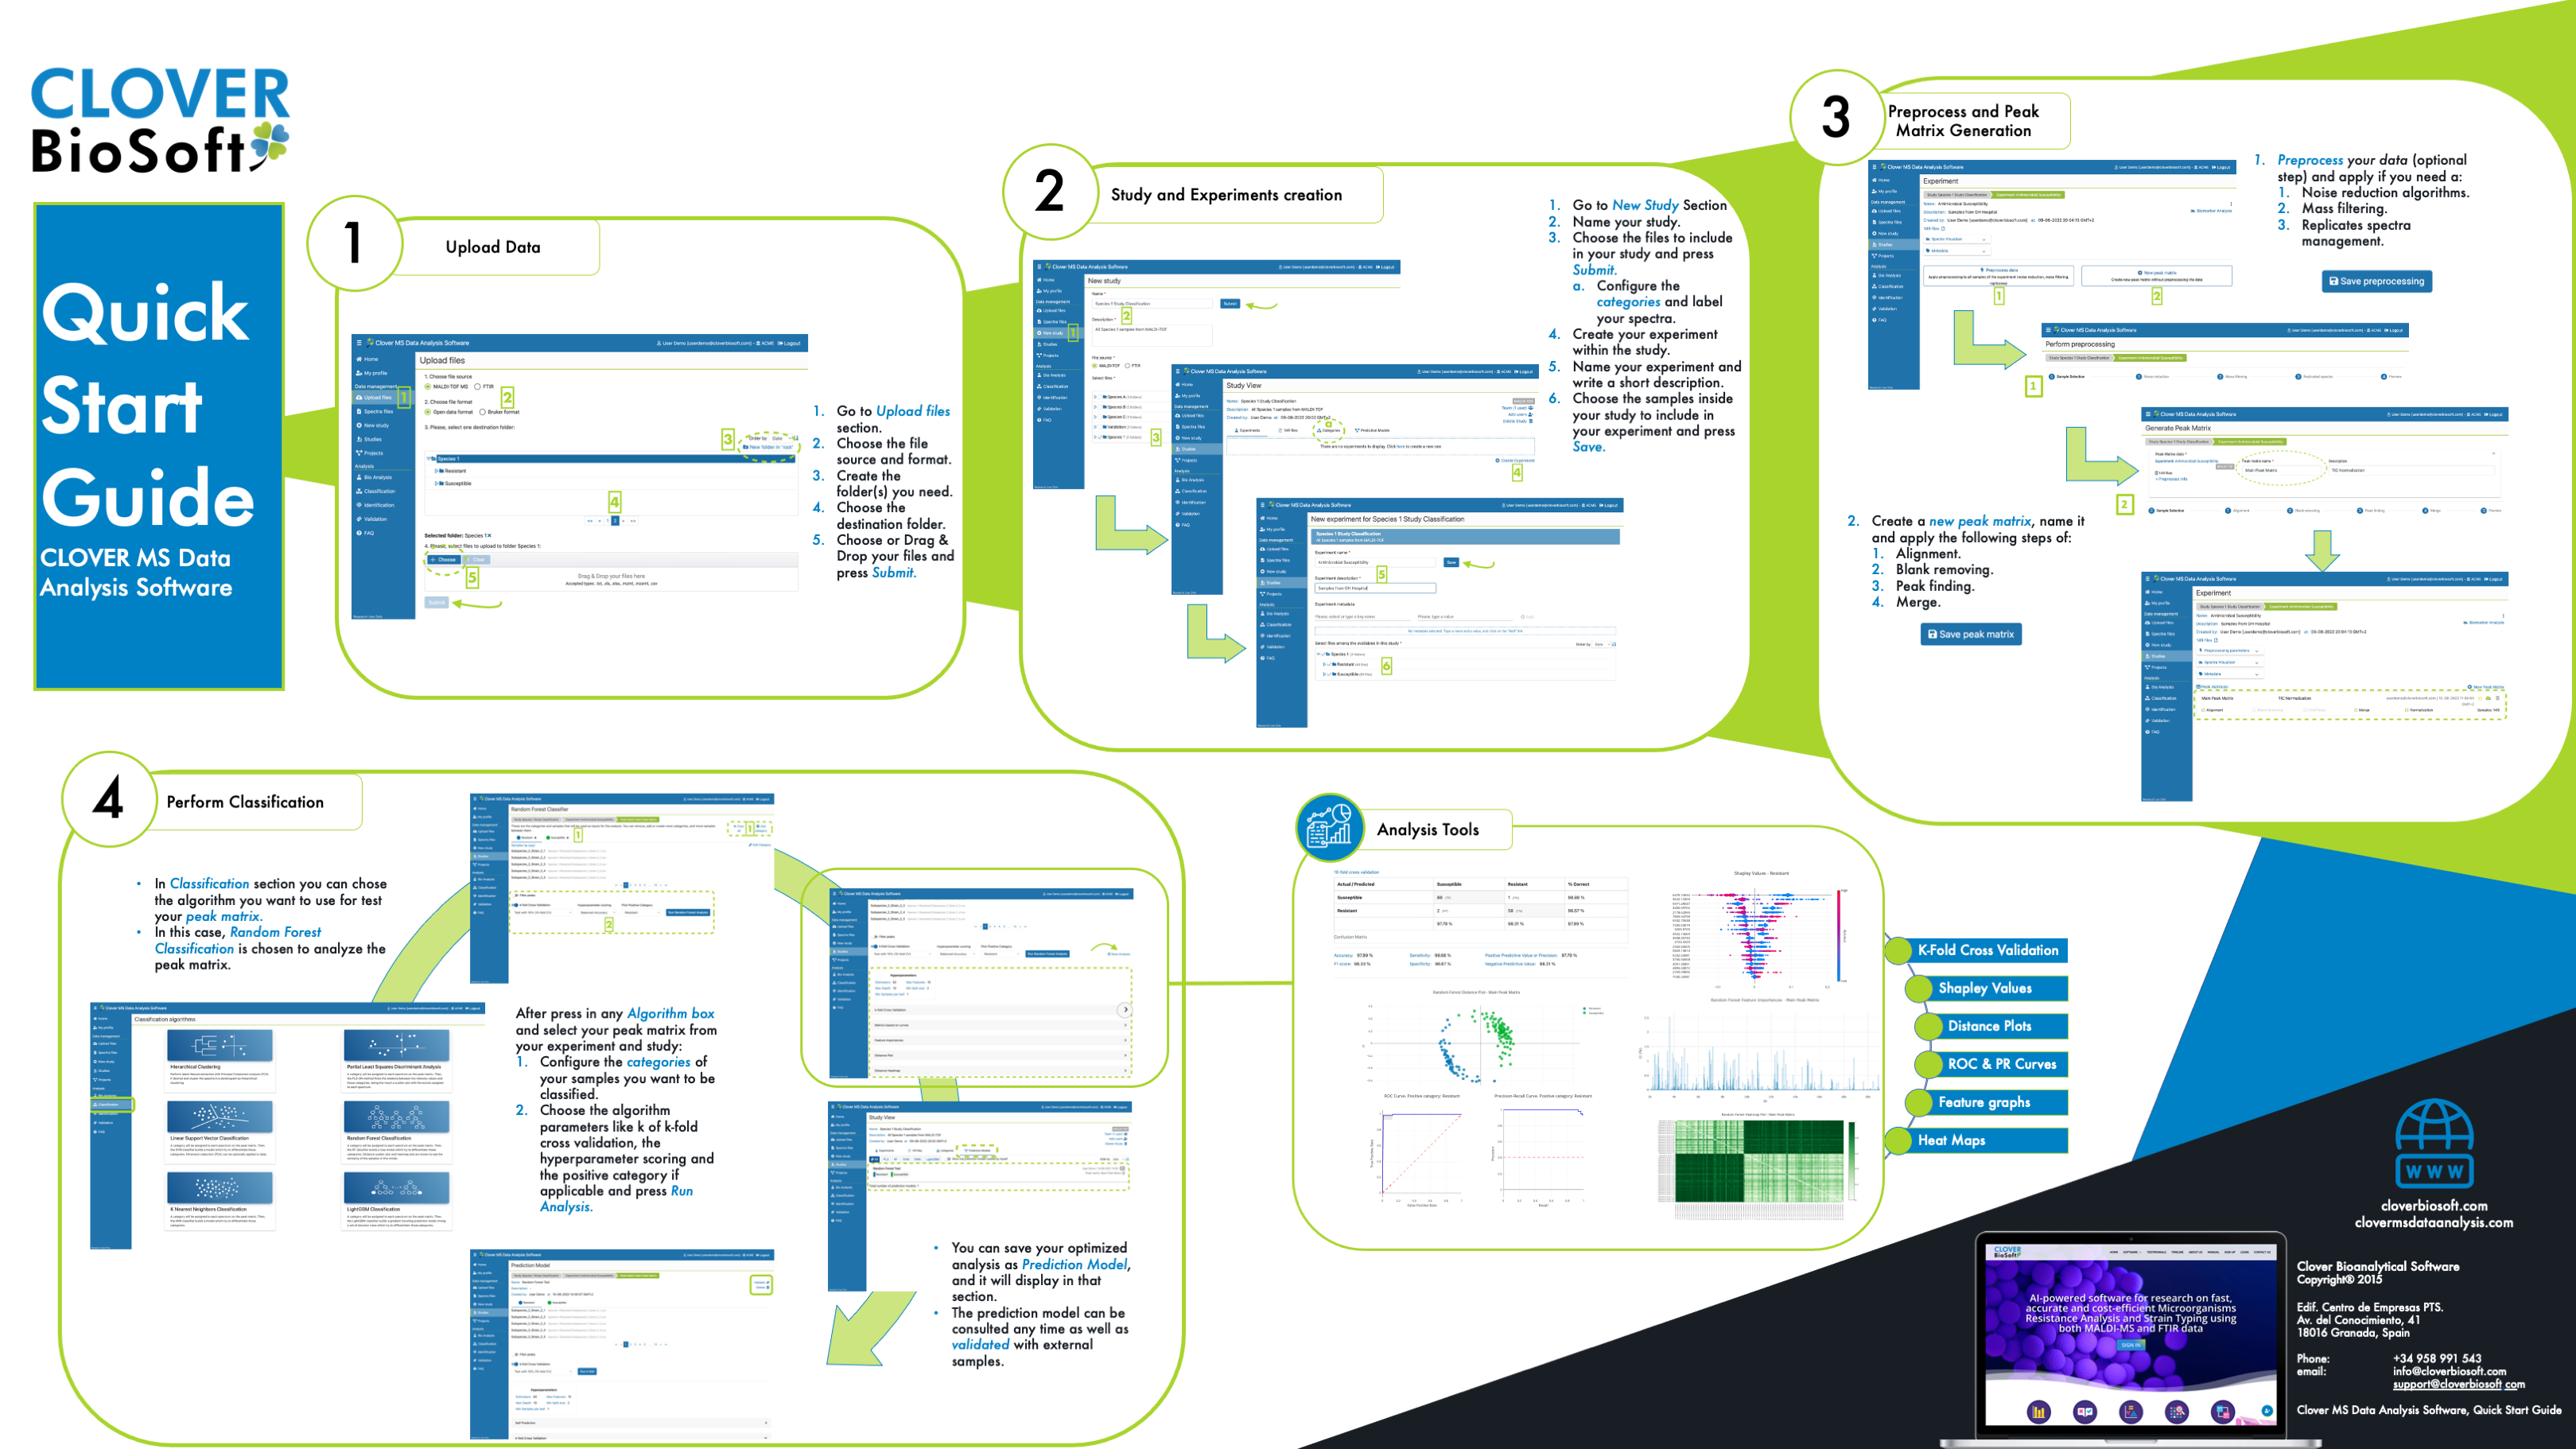
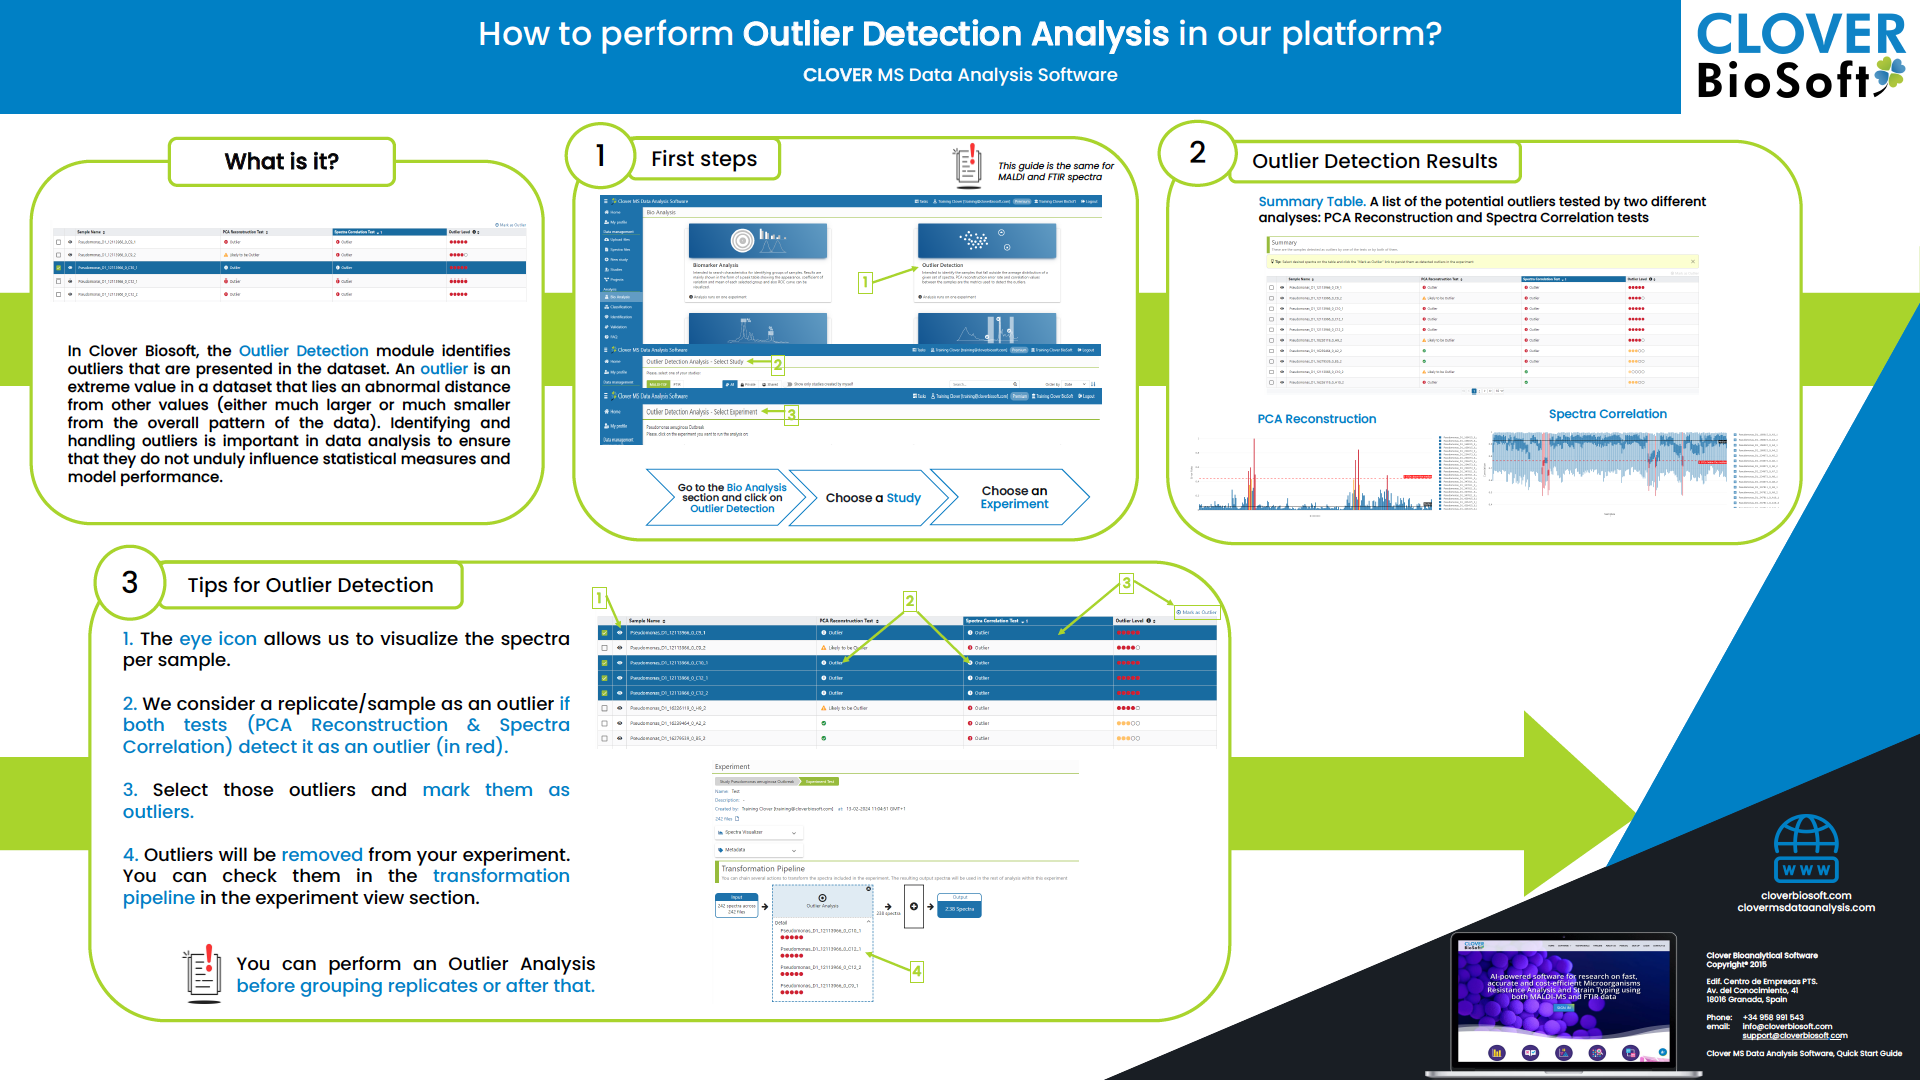
A Quick Start
Clover MSDAS easy workflow from spectra upload to building a prediction model for validation.
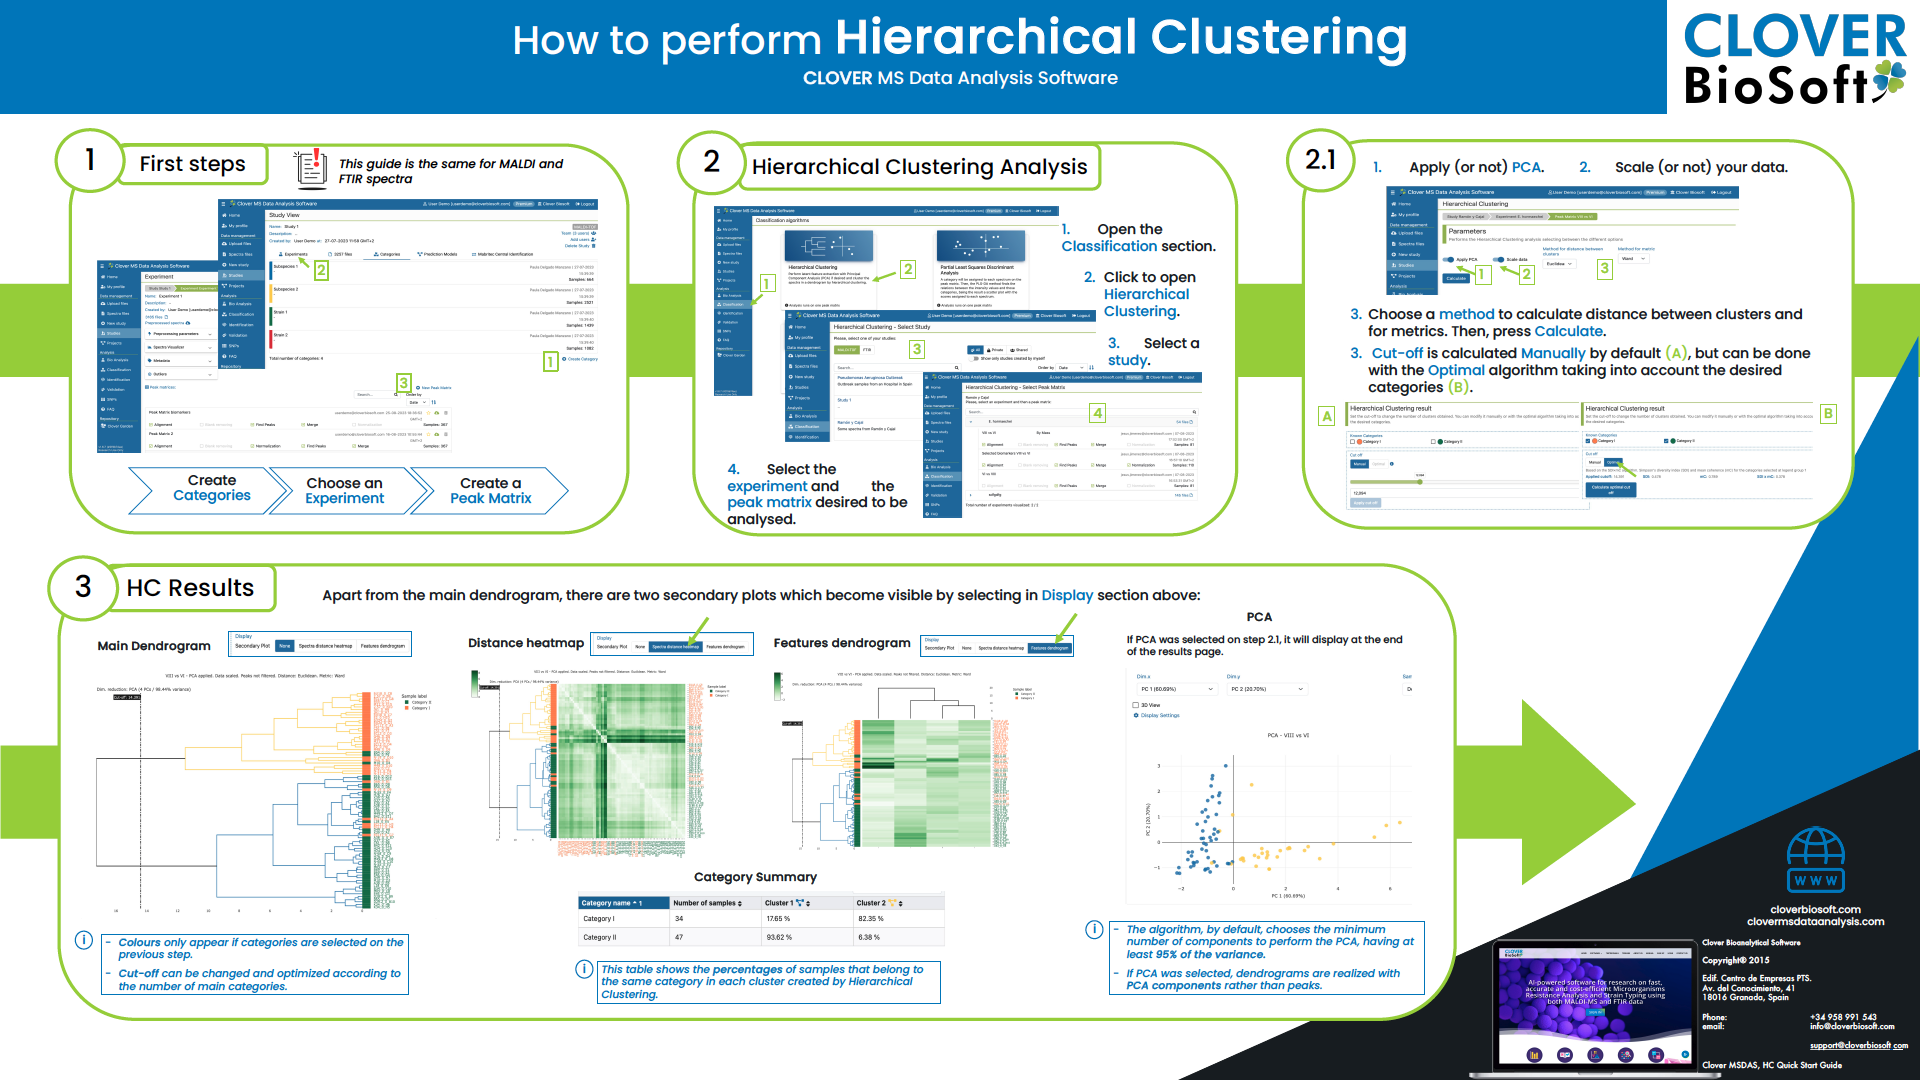
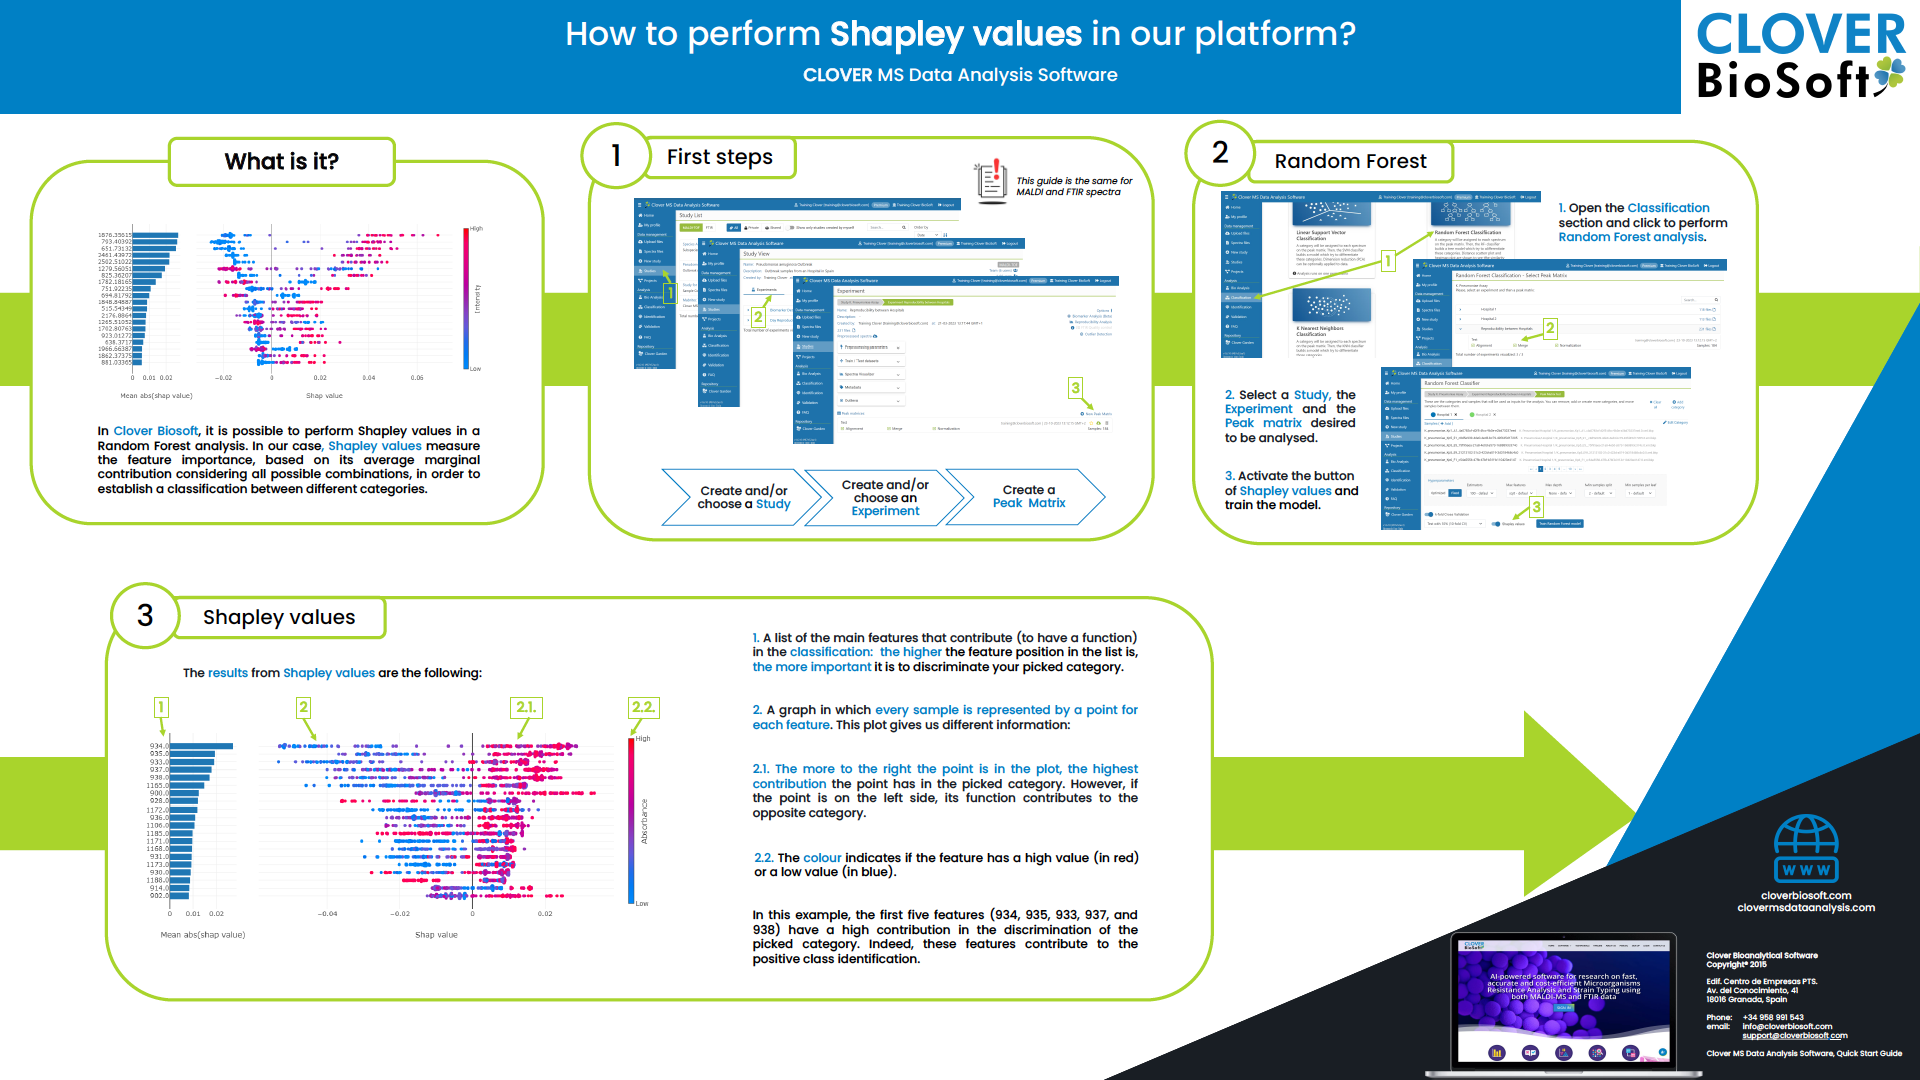
Quick Star Guide for Biomarker Analysis
An easy work-flo to search potential biomarker to discriminate and clasify categories (species, subspecies, ARMs…) using CLOVER MSDAS.
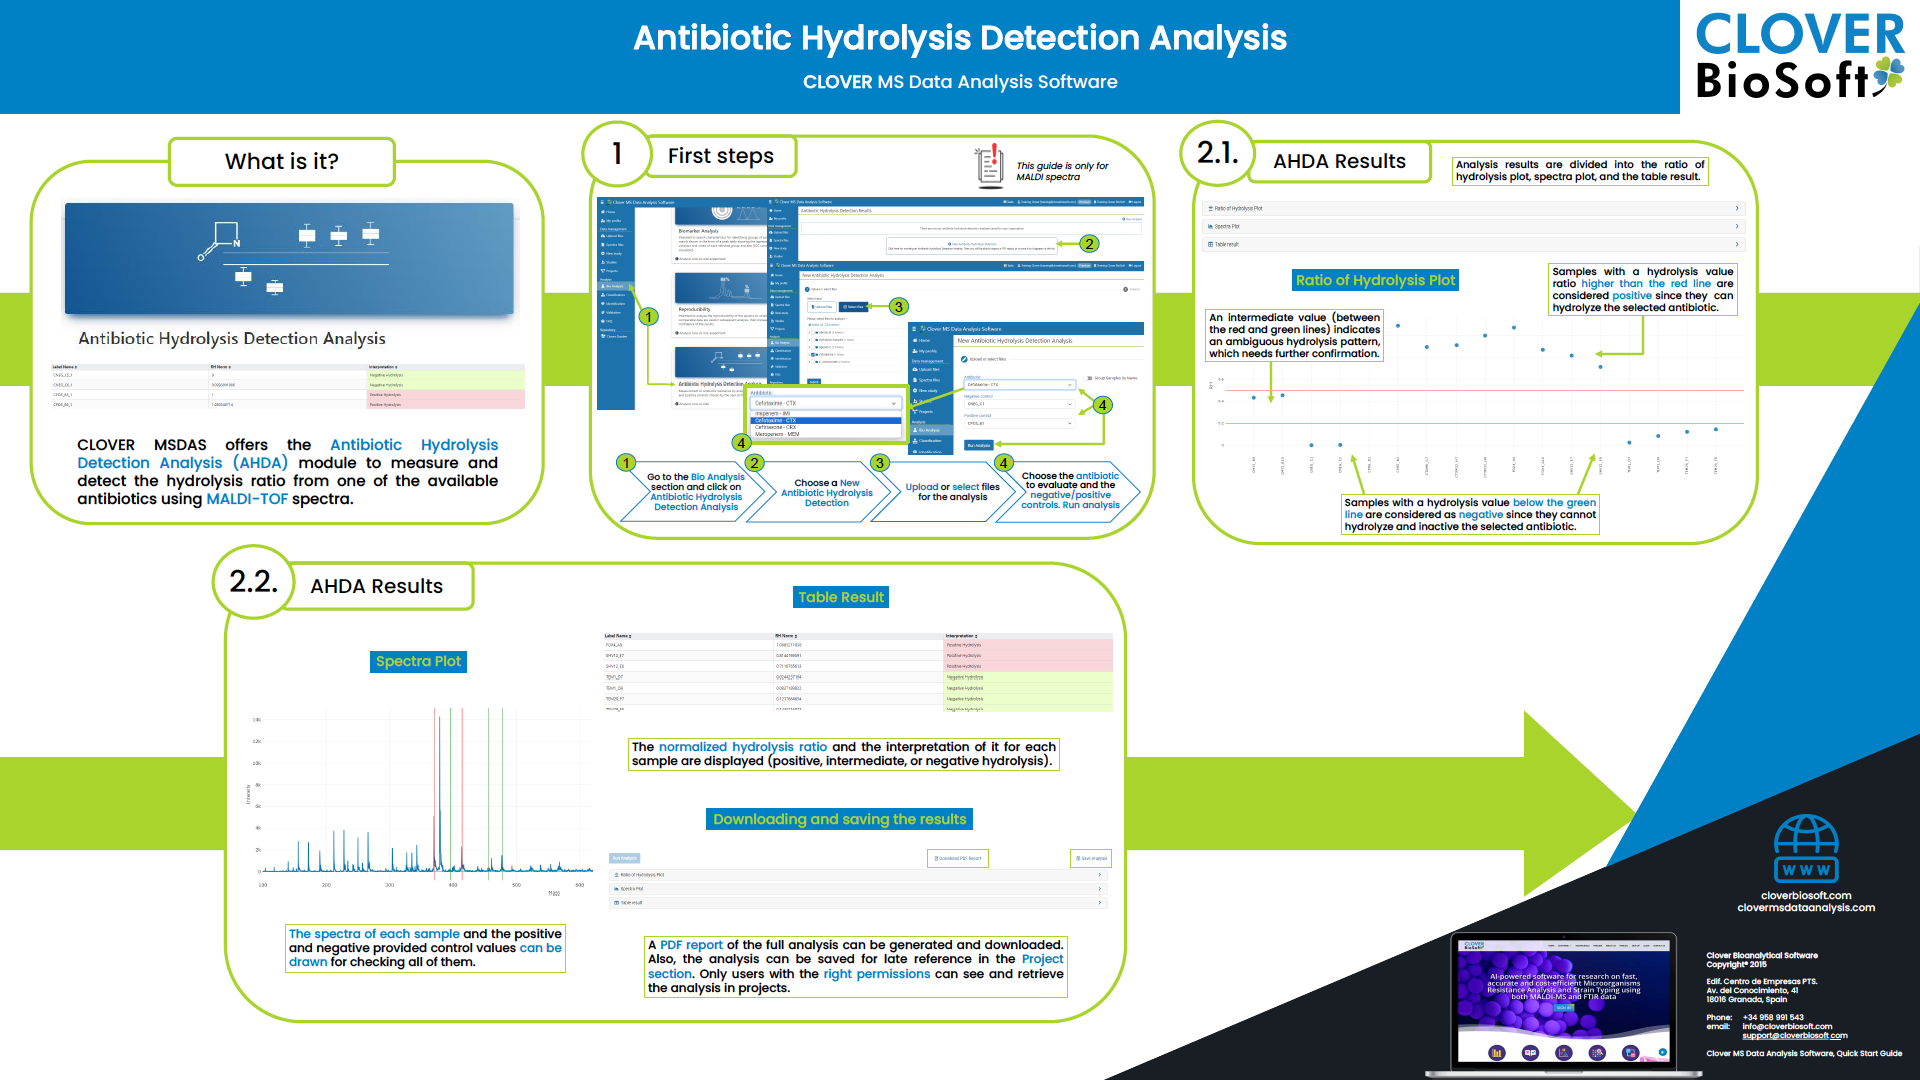
Antibiotic Hydrolysis Detection Analysis Quick Start Guide
A Work-flow to easily detect and measurethe hydrolisysis of a list of selected antimicrobials.
Video Tutorials
Upload Files
Learn how to upload spectra from your instrument to CLOVER MSDAS and which formats are supported.
Studies and Experiments Section
Check out how studies and experiments are managed in CLOVER MSDAS. Learn to create and edit your own studies in your lab.
Categories Tool
CLOVER MSDAS uses categories to tag your data and training sets.
MS and FTIR Spectra Preprocessing
Check out how to very easily apply preprocessing to all your data.
FAQ
How to upload files?
Go to the main menu on the left, at “Upload files” section.
If it is the first time you use the platform, you need to create folders and, if you want, subfolders. Once you have done this, you have to upload your files in those folders you have created and click on submit button.
Don’t forget to choose the correct file source (MALDI-TOF MS or FTIR)
Be careful with the size of your files because if they are bigger than 100 MB you have to separate them in two files first.
How can I check if my files are correctly uploaded?
You have to go to Spectra files section, search for the file, click on the file´s name and then you could see a graphic model as the platform interpretate that file.
How can I work with the uploaded files?
It is necessary to create a new study to start working with your files. Within that study you have to create a new experiment selecting the files you want to work with. Now you able to do a preprocessing for work with your selected files by creating peak matrix.
How can I add or delete files to a study already created?
Firstly, you need to go to your study and then click on the files section. Then you would find at the right position the “Add files” icon.
If you want to delete files of that study you have to go to files section and then click on the cross icon at the right position. In this way you would delete the files of this study but not of the platform.
How to create and change categories?
In your study you can go to the categories option, select create category botton and choose name and colour for this category. Then you have to select edit sample option and choose the samples you want to include in that category.
If you need to edit the category name, you have to click the category and click next to the name and it will appear an edit symbol. Then you can change the name and save it. In the same way you can edit the description.
Who can access to my files?
Initially, you are the only user with access to those files you have uploaded. If you add the files to a study in which there are more users working, then they can access to those files.
How can I share studies?
To share a study, you need to go to your study and then click on the add users option. Then you can choose someone of your team or another existing user in the platform.
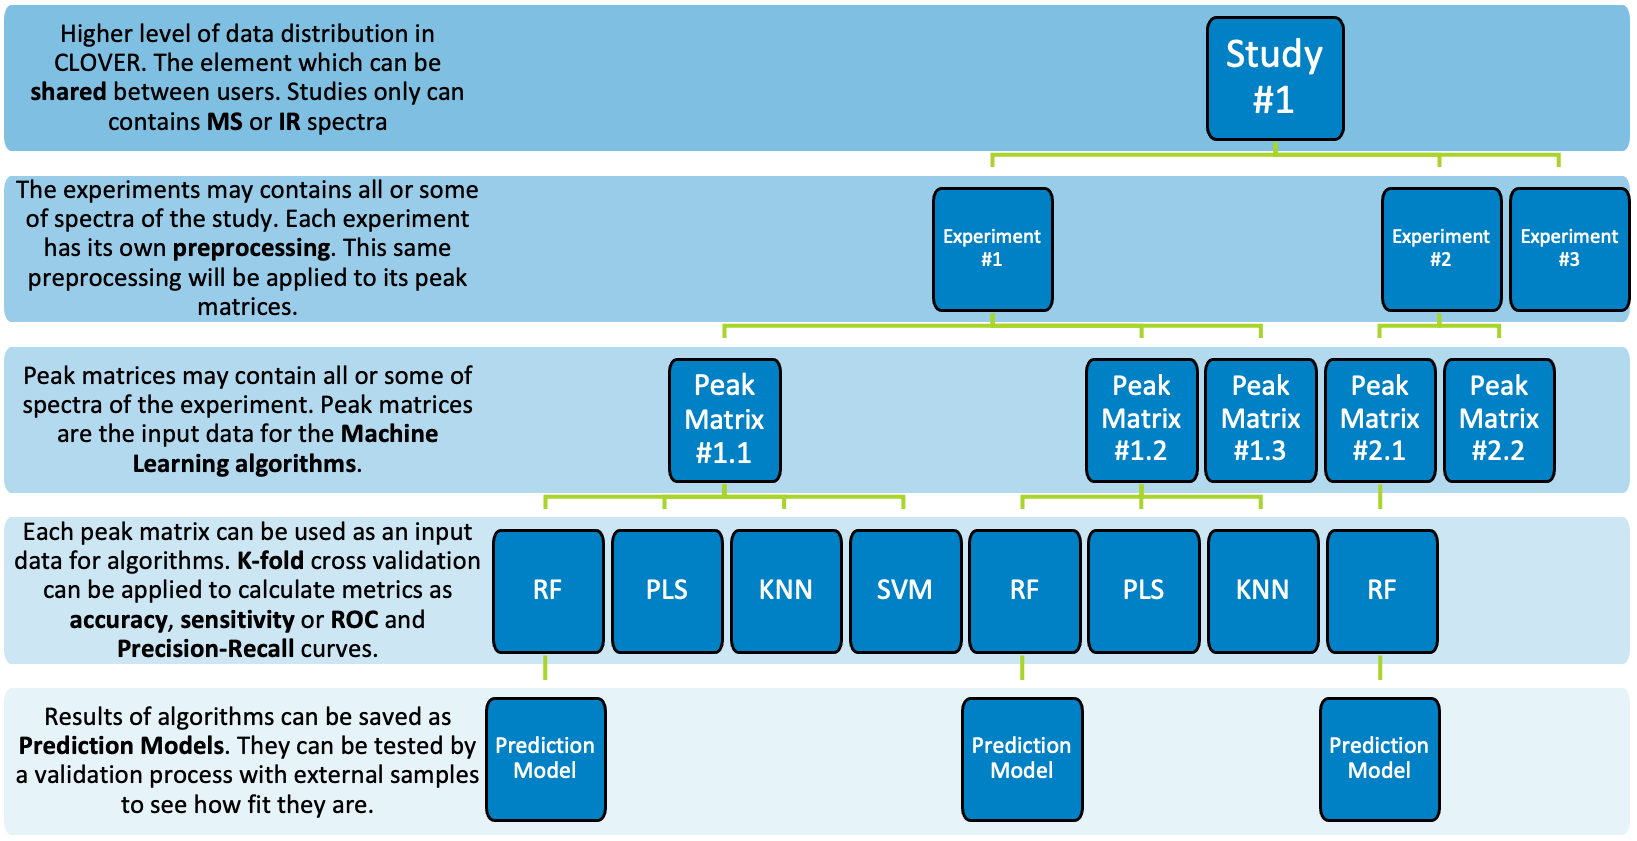
What is the difference between study and experiment?
Clover Bioanalytical Software uses the “Studies” section in Data management as the main folder where all files of the same study are deposited. In addition, within each study you can create different experiments, each one with its own study data and preprocessing parameters.
How to delete an experiment?
If you click on the experiment you would find at the right position a delete symbol.
What happens if I delete some of my files?
If you are the only one who is working with those files then you can delete them, but if there are more people working with those files in studies, you can’t delete them.
What is a peak matrix?
A peak matrix is a set of spectra which is required to perform some of the data analysis and math methods, such as PCA, PLS or SVM.
How to create a peak matrix?
First of all, you need to create a study with the files you want to work with. Secondly, it is necessary to create an experiment inside that study. Once the experiment is created, you will find new peak matrix option. You can also apply a preprocessing, which will be applied before creating all the peak matrices.
Can I create a peak matrix without finfing peaks?
Yes. You can omit peak finding step when you are selecting the parameters. Nevertheless, we recommend to choose this option to reduce the dimensionality of the data.
What happen if I close session and I haven’t fishished the peak matrix?
In this case you could lose your changes so be careful and finished your study before close session.
How to create and change categories?
“Preprocess data” is the main utility in experiment section. It allows make a 4 step preprocessing of experiment data before doing the peak matrices. This avoids the time consuming process of make the same preprocessing for each peak matrix. In this way, when you do a preprocess, all consequent peak matrix will start with the same; samples, noise reduction, mass filtering and replicated done.
How to do a reproducibility analysis?
You have to go to your study and then choose the experiment you desire to run the analysis on. Then you have to click on the Biomarker Analysis option. Currently, the last step of the Biomarker Analysis screen can be used to make a reproducibility analysis too. Just remember that the samples in this step were already preprocessed and maybe the replicates were done too.
What is the noise reduction parameter?
In this step you can smooth the spectra by applying two different techniques.
Baseline substraction. It has two options:
– Default baseline: It substracts a polynomial model with a determined Degree order (highlighted in yellow) to the original spectra to create the smoothed one (highlighted in green).
– Tophat filter: In this case the shape of the model is a rectangular function. The Factor parameter determines how finely the filter is applied to the spectra data.
Saviztky-Golay filter: It has two parameters: the length of each subset of adjacent data points and the degree of the local polynomial that will be used to fit those successive subsets.
What is the mass filtering parameter?
In this step you can discard a subset of masses in each sample of the experiment.
What is the blank removing?
In this step, you will remove unnecessary data from the samples. You have two options: you can set the mass range that you want to remove from every sample spectra or you can use the blank data you set in the first step.
If you choose to use the provided blank data, the blank values will be taken into account in the analysis but as blank values, with a different consideration to the rest of the spectra.
What is the replicated spectra step?
In this step, you have to group the replicated samples and remove those you do not want to include in the peak matrix. You can do it manually or:
– Replicate by sample name: The system will automatically suggest different numbers of possible groups based on the prefixes of the samples names.
– Replicate by replicates per group: You manually set the number of groups that you want and the system will find the best distribution based on the names prefixes.
Don’t forget to press Apply botton.
What is the k-fold cross validation parameter?
This test is in the supervised classifiers analysis (PLS, SVM, Random Forest). It appears if the user has selected the corresponding option before running the analysis. Data will be splitted in K subsets with equal size as stated by the k-fold parameter. Then, k-1 subsets are used as training data and the remaining one is used to validate the analysis. The K results are finally averaged and distributed in a confusion matrix.
What is the difference between the biomarker analysis view and the peak matrix generation?
The biomarker analysis offers a set of graphics, tables and metrics that will help you to identify which mases can be biomarkers. Peak matrix is not created in this analysis. However, at the peak matrix generation section, you can create a peak matrix which use as input data for further analysis.
Support Contact
Contact Information | Clover Bioanalytical Software
Phone Number
(34) 958 991 543
Office
- Edif. Centro de Empresas PTS.
- Av. del Conocimiento, 41
- 18016 Granada, Spain
Copyright © 2024 I Privacy Policy
